I began this project in mid-September 2020 when I had just started trading in the Indian stock market. Initially, I thought of trading as gambling. However, during the lockdown when I had spare time and everyone was discussing how everything was going up, I became more active.
I used to check financial data on the NSE website and take trades. However, it was a very time-consuming process. Being an academician with a strong background in data analysis and coding, I started writing code to visually analyze the data so that I wouldn't have to check numbers manually. My objective was clear: to develop something that would allow me to analyze stocks and the market quickly. Visual analysis of data and drawing inferences swiftly is crucial for making decisions.
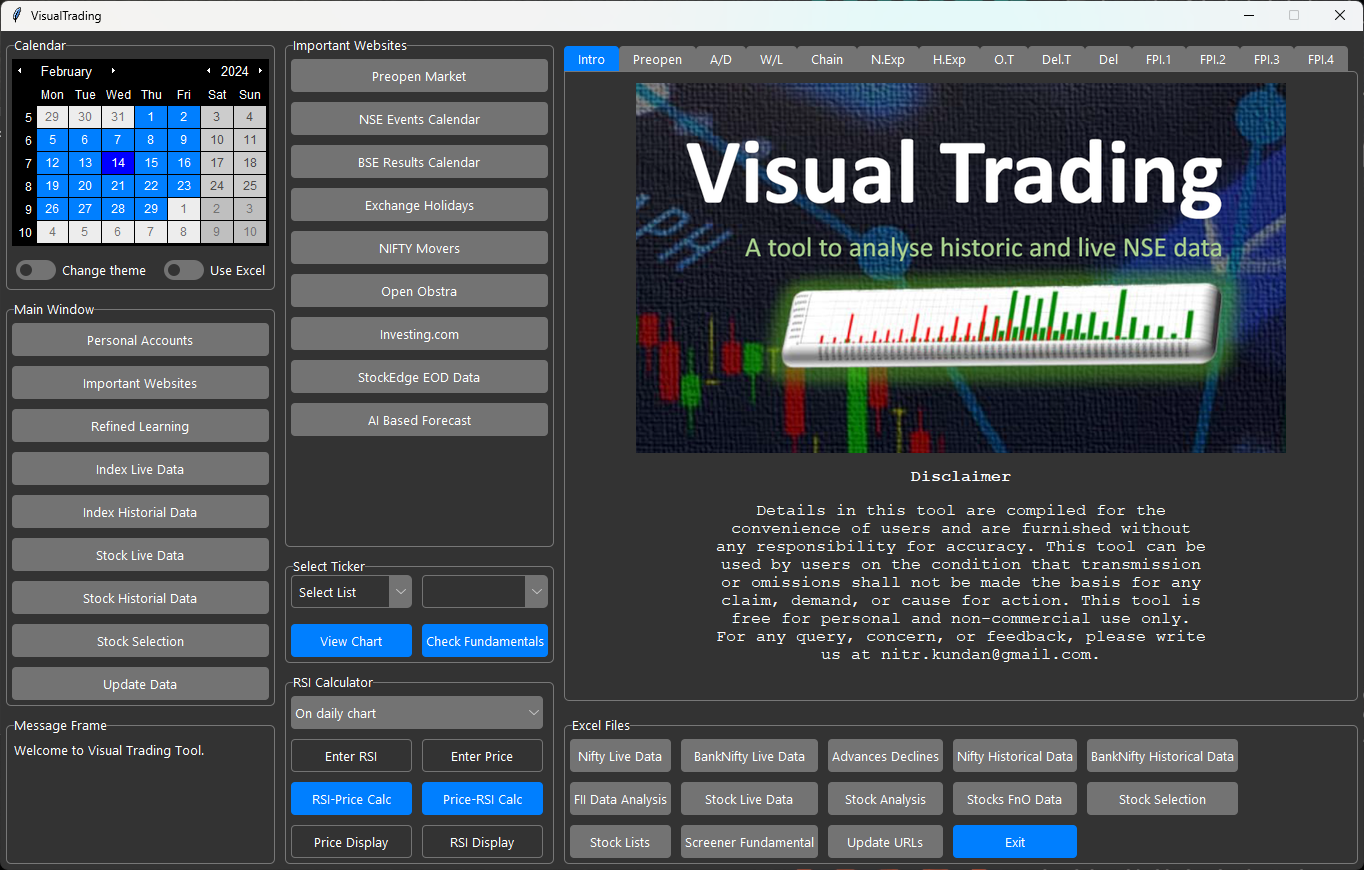
Thus, Visual Trading came into existence. Through Visual Trading, I can analyze stocks and market indices by processing the data and representing it visually. It processes data both online and offline, making it useful for day traders as well. The tool is user-friendly in my experience and fulfills its purpose. Additionally, it can screen stocks based on certain criteria, and we can create those criteria on the fly.
Unique features
-
Live Data Processing
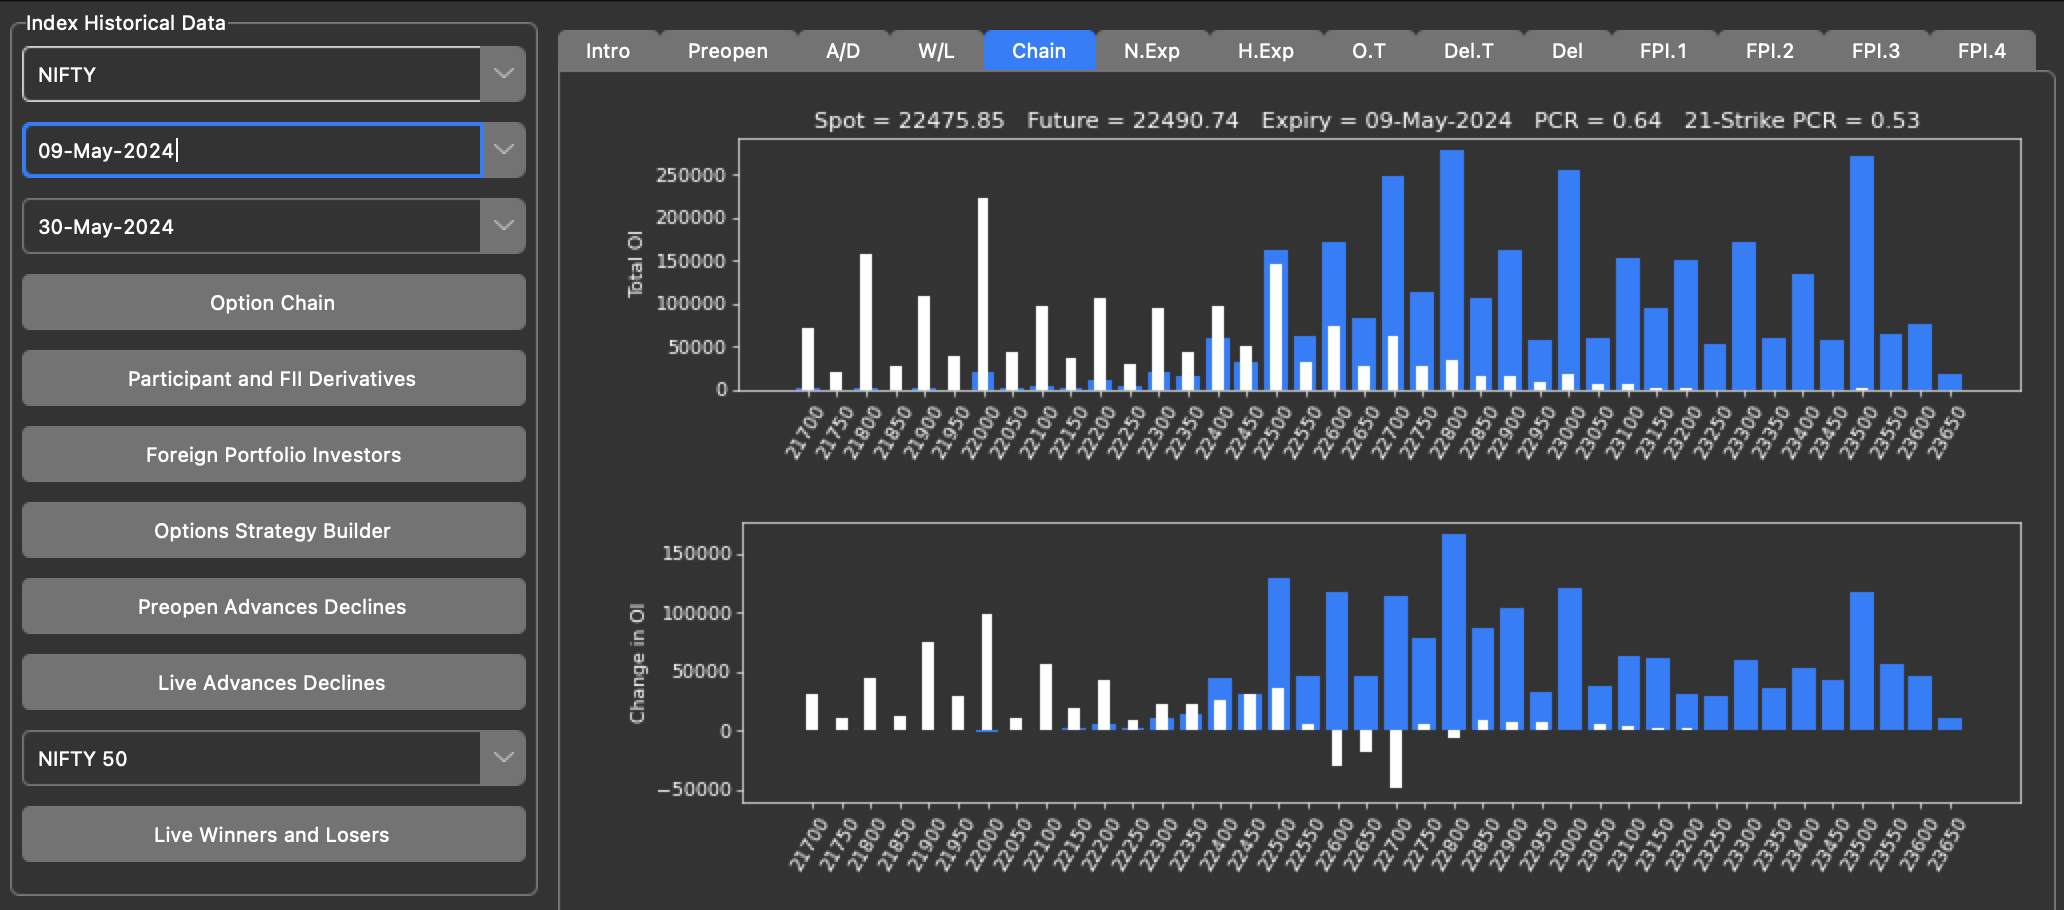
Looks at price actions and change in option chain at differnt strikes to check the market or stock behavious in the live market.
-
Option Chain and Greeks
Option chain for stocks and indices in visual form to find the probable support and resistance and the option greeks to make better decisions.
-
Option Strategy Builder
Supports to create an option strategy with multple legs. It can analyze the multple strategies along with adjustments.
-

Stock Screener
Select stocks from diffent list of symbols or consitituent of indices or within the watchlist, based on customizable criteria on the fly.
-

Historical Data Processing
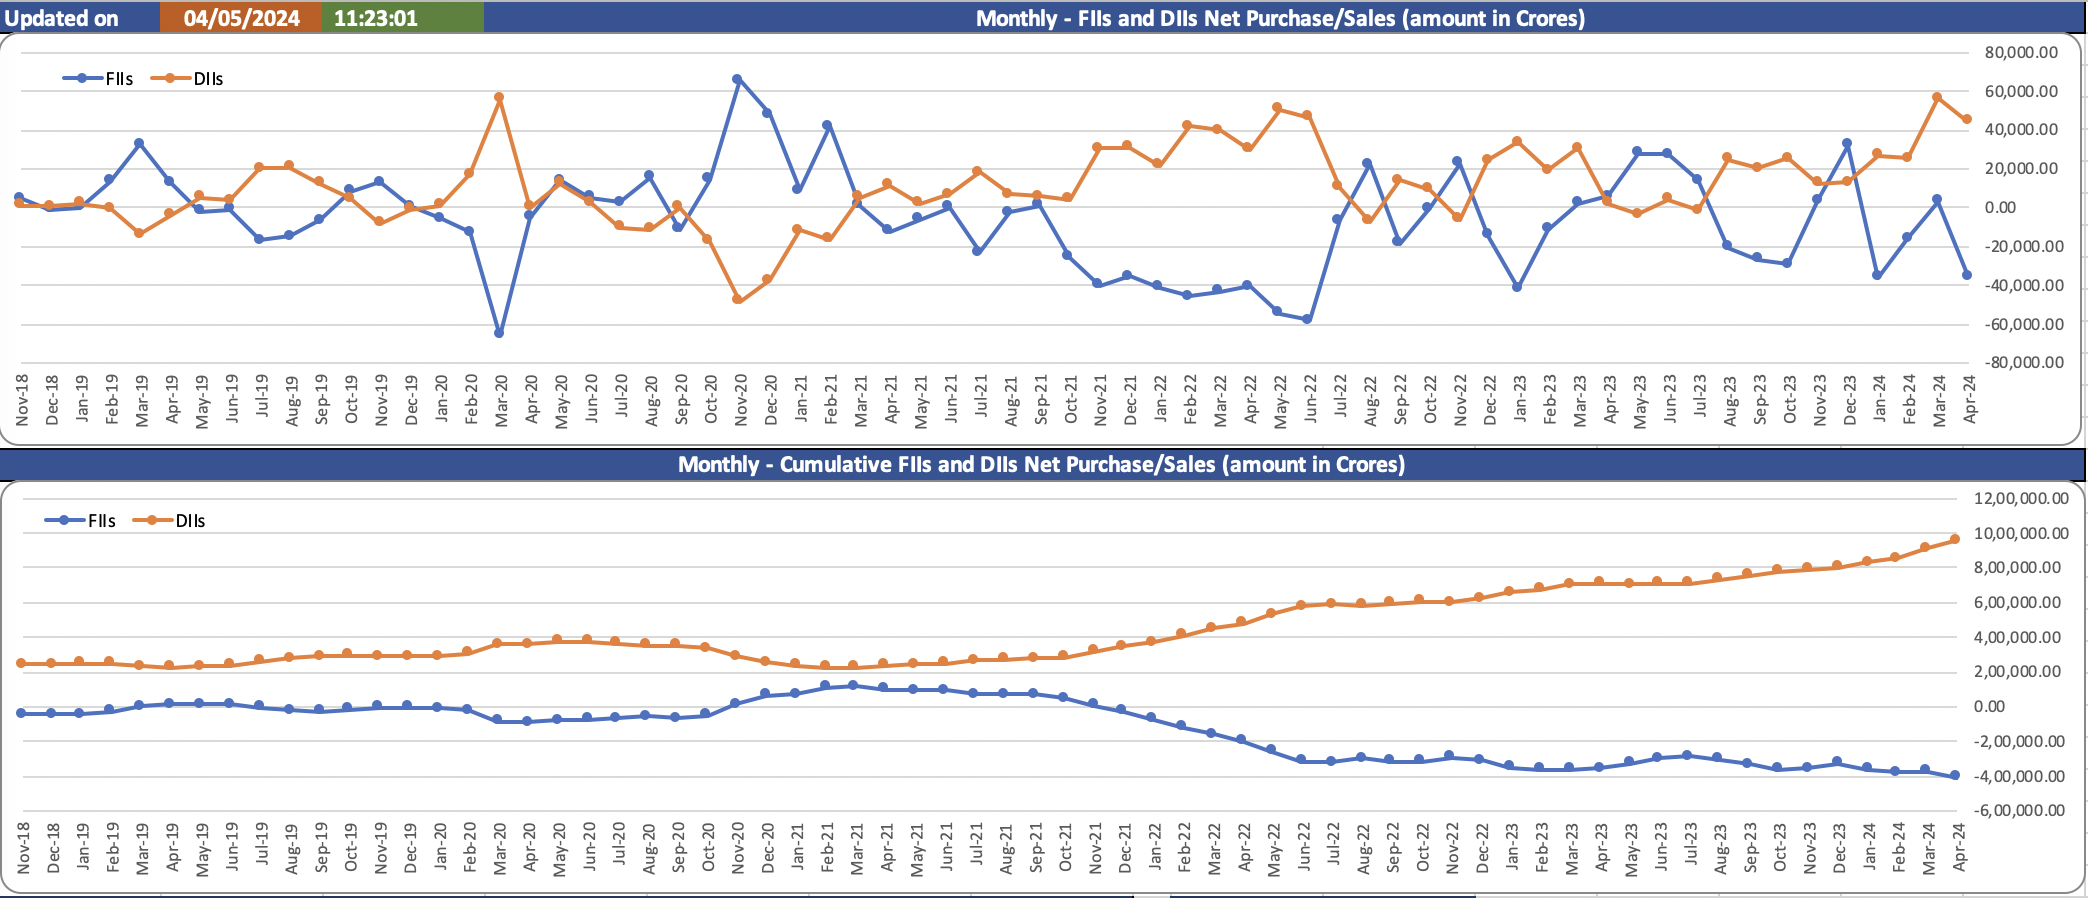
Analyze historical data of stocks and indices. Money inflow-outflow analysis in a stock, delivery data analysis. FII and DII data analysis. Fortnightly Sector-wise FII Investment data analysis.
-
... and many more.
All the functions are single click away. Customizable buttons for ease of users. Quick access to charts. RSI-to-Price and Price-to-RSI calculator for differnt timeframe. Auto download Bhavcopy, symbol list, expiry dates, etc.
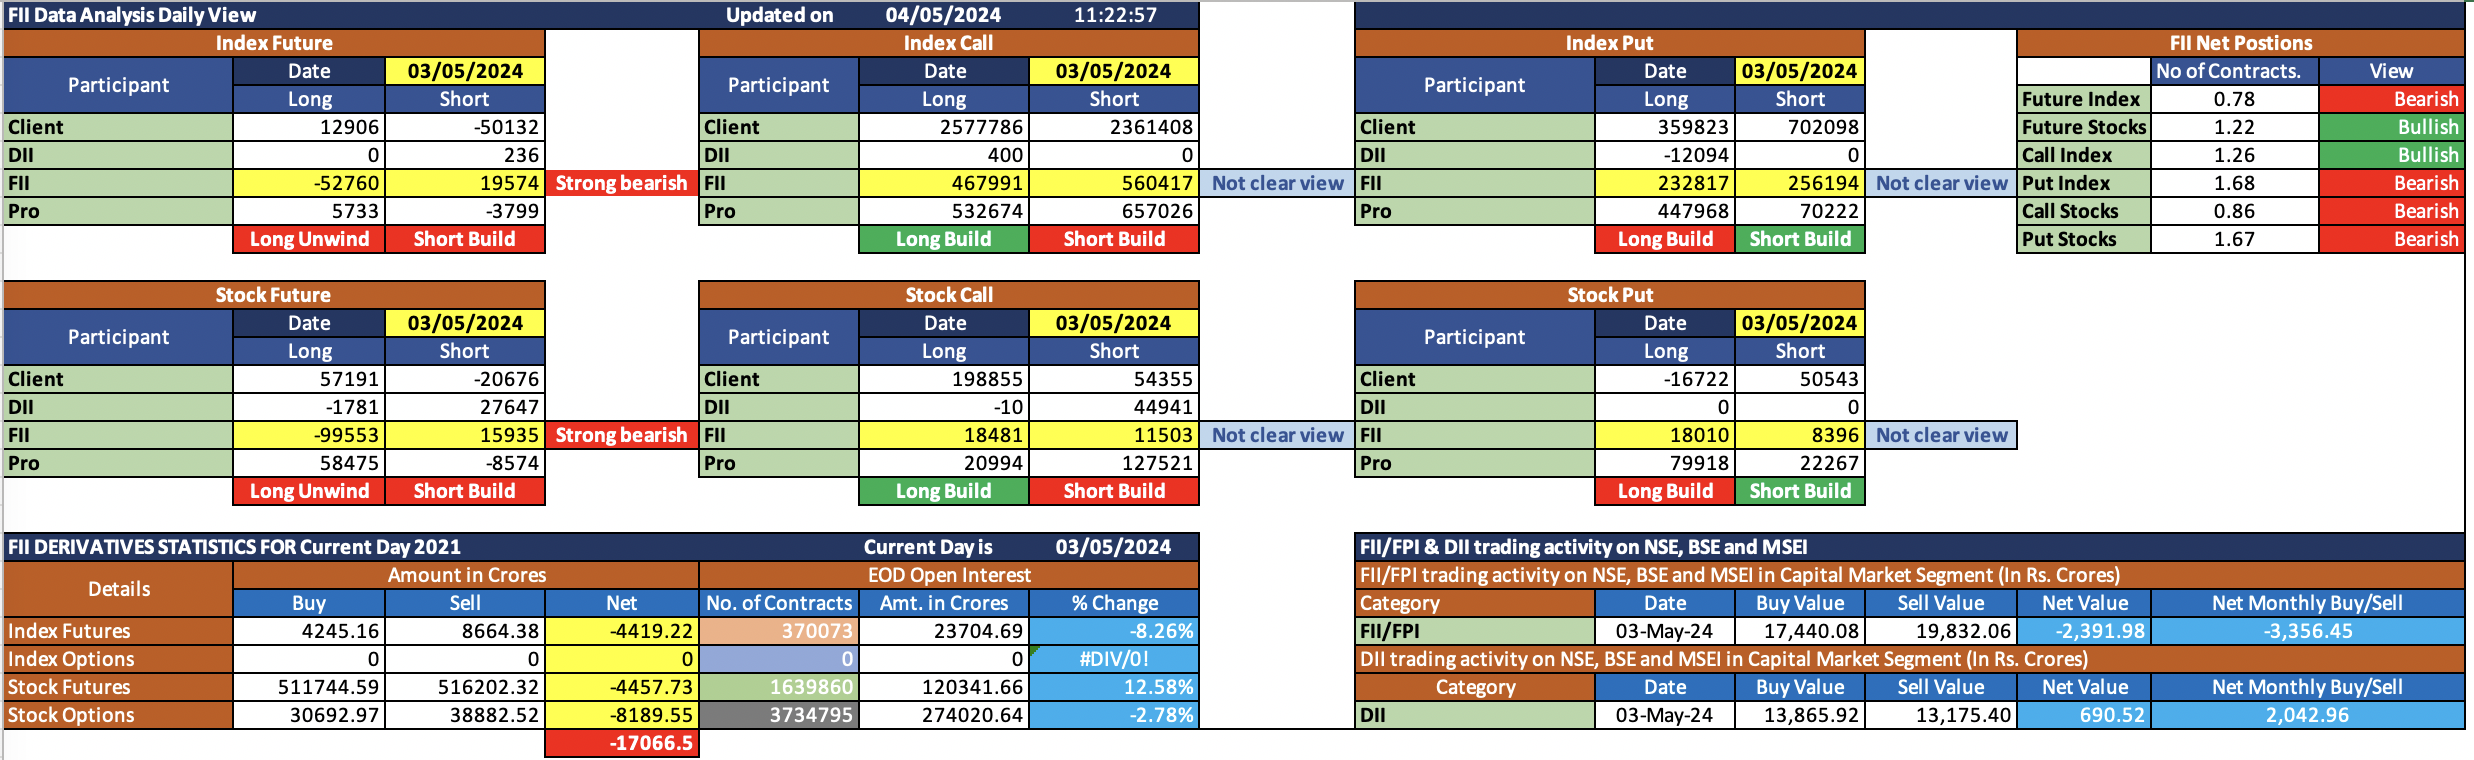
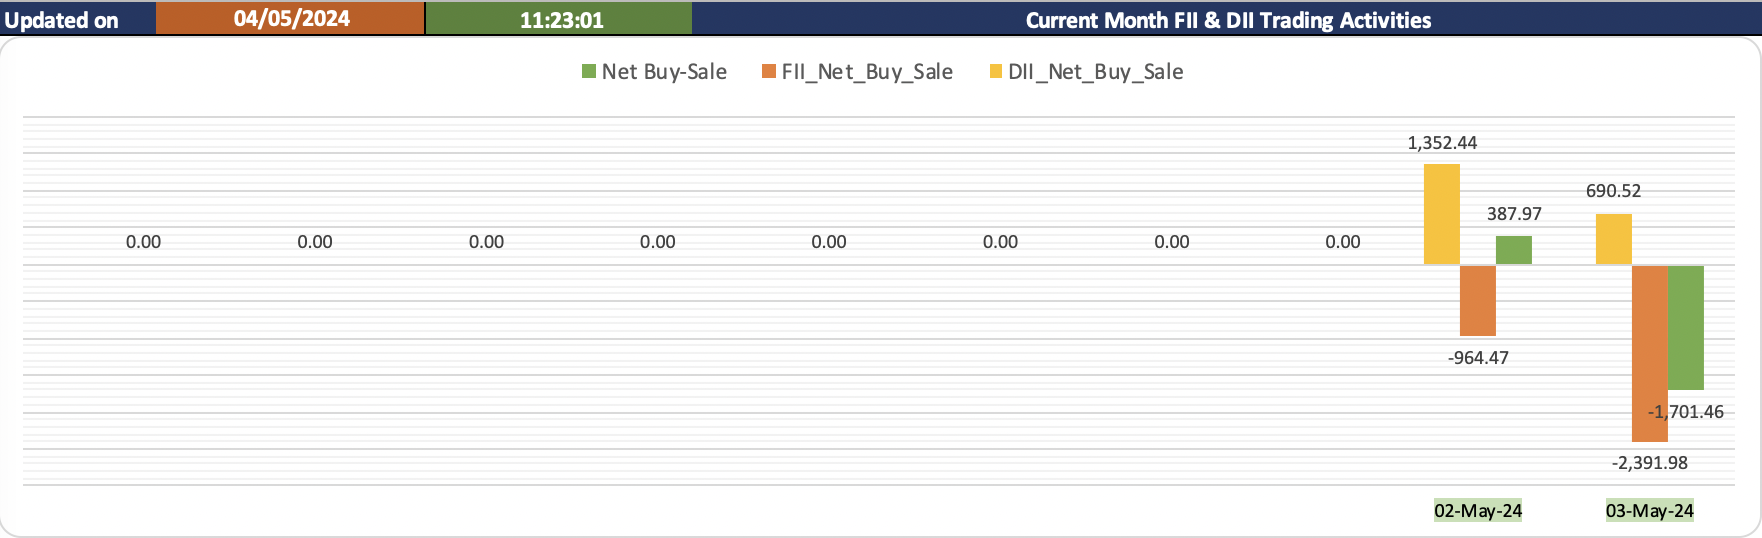
FII and DII Data Analysis
-
This analyses the FII and DII data also present data visually.
-
FII, DII, and Net Buy-Sell.
-
This analyses the FII and DII data also present data visually.
Options Data
-
Option Chain of Index
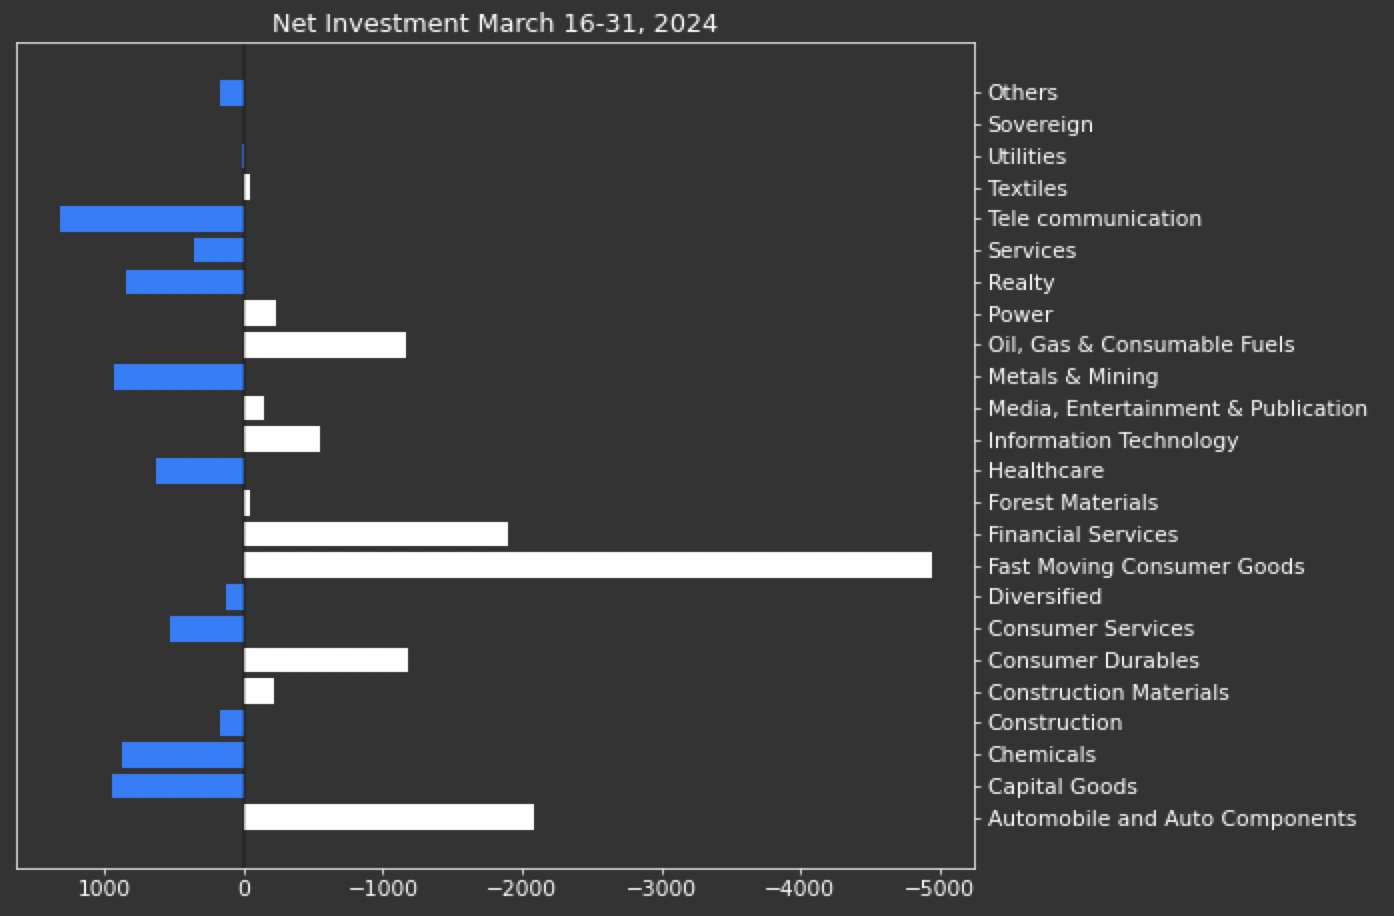
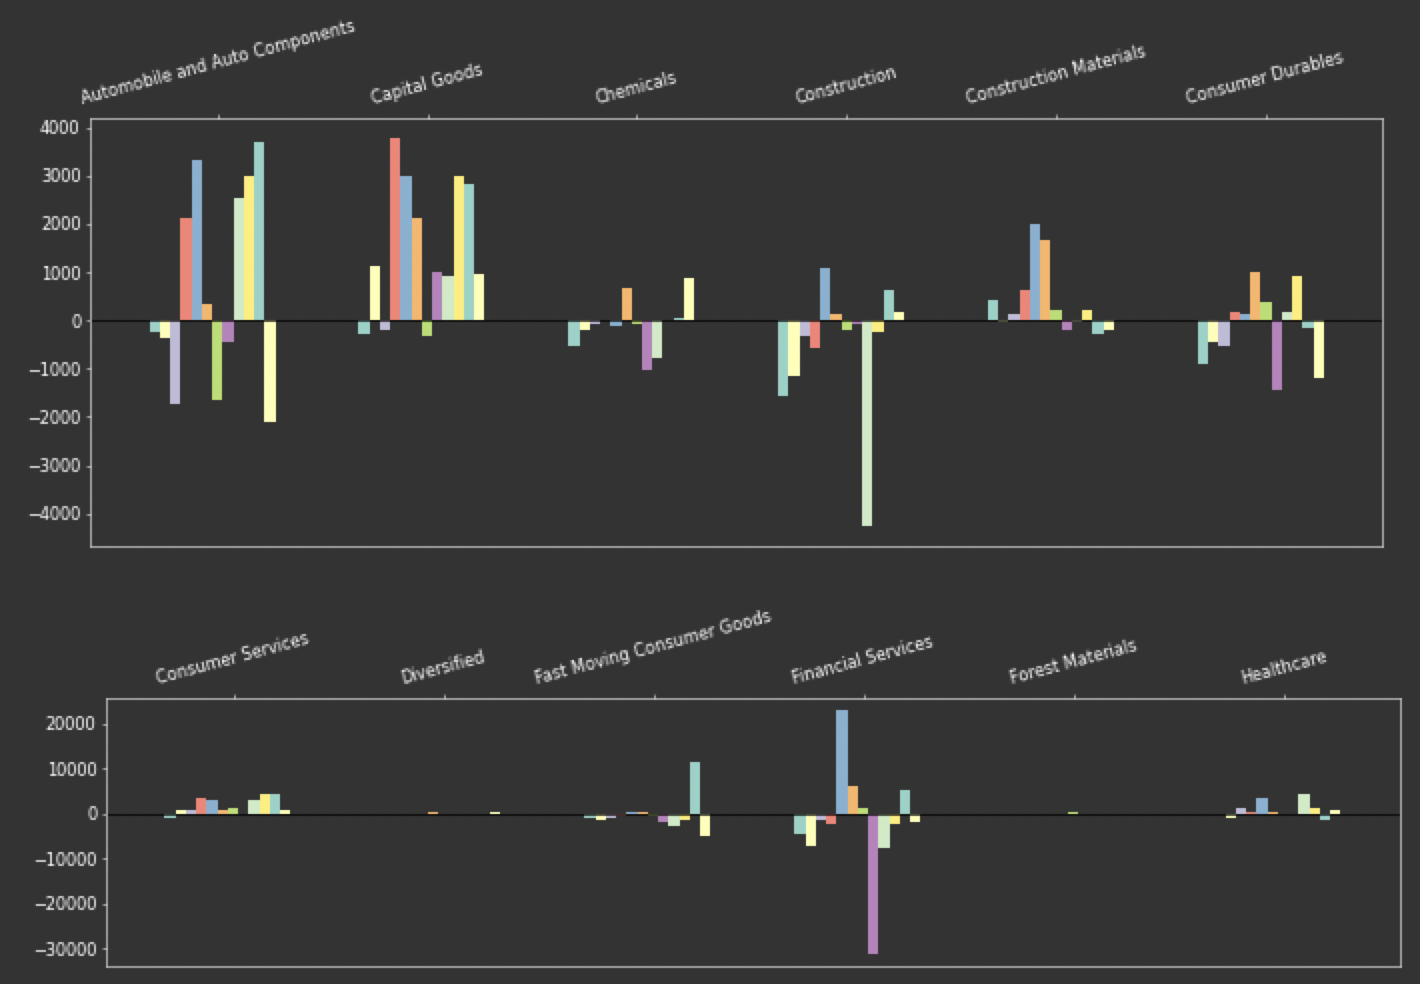
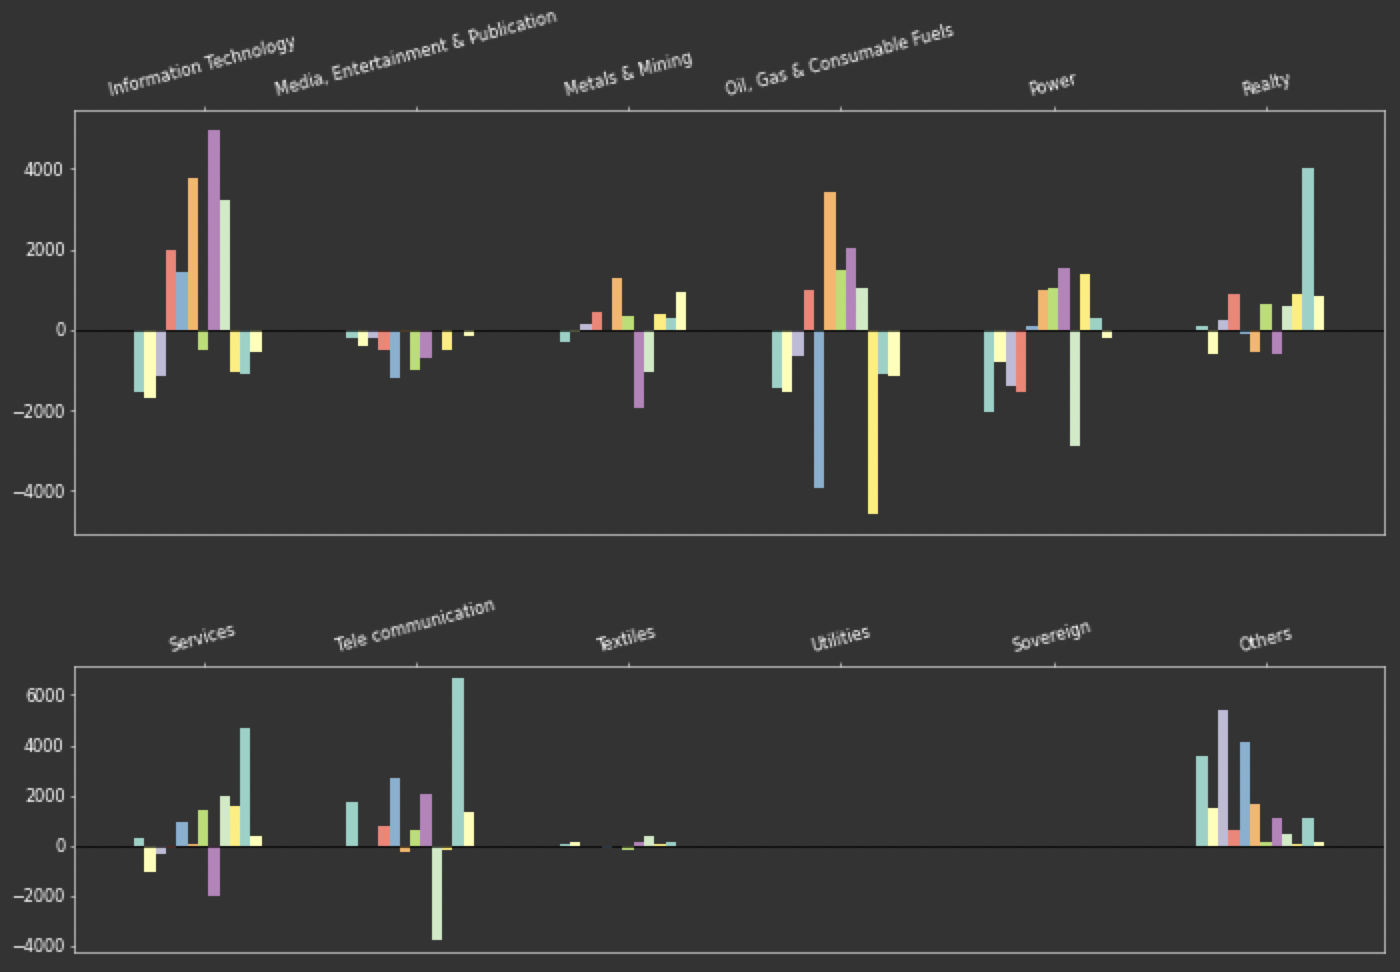
FPI Data Analysis
-
Foreign Portfolio Investment (FPI) in different industry (latest 6 months)
-
Current month FPI activity